The Importance of Training Intensity in Athletic Performance
Training intensity is a cornerstone of athletic conditioning, playing a pivotal role in enhancing performance. The intensity in endurance sports refer to metabolic state of the athletes body, do you currently work aerobically or an-aerobically.
Understanding the intensity in each workout allows for tailored training programs that target specific energy systems and performance goals. By manipulating intensity, athletes can achieve peak performance and gain a competitive edge. Training intensity is not about working hard; it's about working smart. Recovery workout needs to be easy aerobic or harder sessions around an-aerobic threshold. Each workout is defined by intensity and duration. However the challenge is to know each day, what is easy today or do I go too hard in my intervals.
Aerobic and An-aerobic Thresholds
The aerobic and anaerobic thresholds have been instrumental in refining training intensity. The aerobic threshold marks the exercise intensity at which the body can sustain energy production primarily through aerobic metabolism, with minimal lactate accumulation. Training at or just below this threshold enhances endurance and the efficiency of energy systems. The anaerobic threshold (AT) or lactate threshold (LT) signifies the point where lactate begins to accumulate faster than it can be cleared, indicating a shift to more anaerobic energy production. Training at or slightly above this threshold improves an athlete's ability to sustain higher intensities and delays fatigue.
Measuring the intensity
Over the past decades, the measurement and understanding of training intensity have evolved significantly. Initially, subjective measures like the Rating of Perceived Exertion (RPE) were widely used, providing a simple yet effective way for athletes to gauge their effort levels. However, as sports science advanced, more objective methods were developed. These include heart rate monitoring, power output (in cycling and rowing), and pace (in running and swimming), which offer precise quantification of intensity.
Heart rate as intensity metric
Heart rate monitoring has long been a valuable tool for gauging workout intensity, providing a non-invasive and straightforward method for athletes to assess their effort levels. The heart rate corresponds to the body's demand for oxygen and energy during exercise; as intensity increases, so does the heart rate. However, heart rate alone doesn’t tell the “actual intensity”. Running with heartrate 150 can be aerobic or an-aerobic. As the intensity refers to athlete’s state of the body, am I working aerobically or an-aerobically, heart rate measurement is just not enough.
This has been one of the key challenges for wearable industry. Personal aspect of the heartrate. One athlete can run aerobically with heartrate of 160 and where the other one with same heartrate is over an-aerobic threshold. The heartrate value as such doesn’t tell what the actual intensity in terms of body metabolic state is. Therefore, there is various zone-based equations that try to help consumers to set the right levels. This is extremely difficult as each person’s body works differently and different sport have different intensity levels.
Finding the truth from the lab
This is where laboratory testing comes into play. Lab testing tries to measure direct biochemical markers to analyze transition from aerobic to anaerobic metabolism, offering a more precise determination of the appropriate intensity levels for training. This is usually done by measuring blood lactate concentrations at incremental exercise intensities.
The lactate threshold (LT) is most common way to define the an-aerobic threshold, but it is influenced by numerous factors, including individual fitness levels, metabolic responses, and exercise modalities. Different methods allow for flexibility in measurement based on the available equipment, the specificity of the sport, and the precision required for the intended use. Some methods are more suited for laboratory settings, while others can be applied in the field. As scientific understanding of LT evolves, new methods are developed to reflect the latest insights into how lactate behaves in the body during exercise.
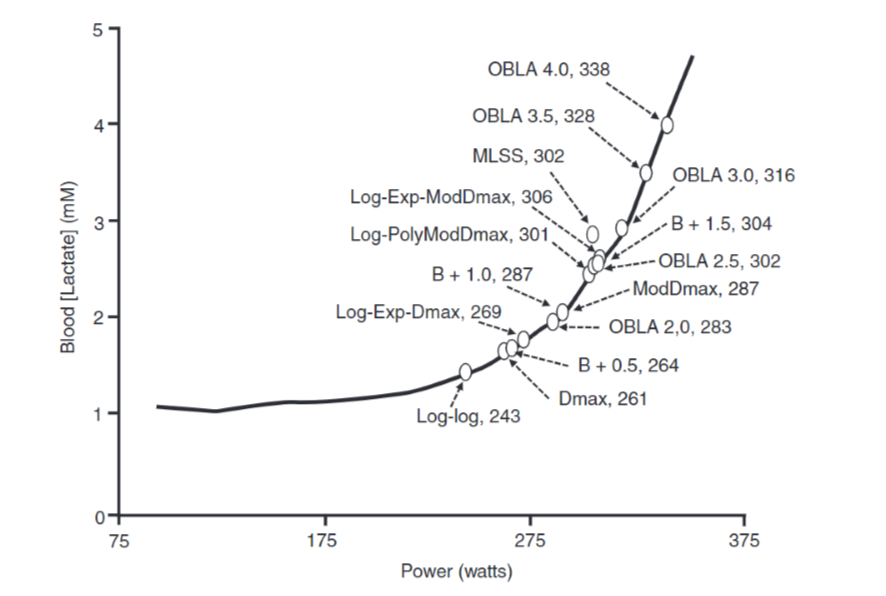
The different methods also highlight the challenge of defining the anaerobic threshold for each individual athlete. In the end, for the athlete to get the right intensity levels, depending of the testing protocol, laboratory, and personnel the results can be very different. This was illustrated with the research article on one graph where various lactate threshold methods were defined for one test dataset. The range of results were massive, where result of threshold could have been between 243 watts to 338watts. The graph shows each method as a circle on the lactate curve and the number after the method with the resulting power number.

Picture from the article the anaerobic threshold: 50+ years of controversy by David C et all (3), illustrates the different methods to evaluate the lactate threshold in one graph.
Getting the lab results to field
There are several challenges to utilize the lab results in daily training. These are due to several factor.
Differences in Sports
Different sports have different intensity levels. Doing the lab testing in running treadmill or cycling ergometer doesn’t mean that these intensities could be used when cross country skiing or playing soccer. This creates a challenge where the measurements in test protocol doesn’t reveal the actual intensity levels athletes would use in specific sport they might use part of their daily training.
The type of sport has different intensities influenced by the muscle mass involved, the movement pattern, the biomechanics, the energy system contribution, and the environmental conditions.
- For example, running involves more muscle mass and eccentric contractions than cycling, which can increase the lactate production and decrease the lactate clearance.
- Swimming involves more upper-body muscles and a horizontal position than running and cycling, which can alter the blood flow and the gas exchange.
- Rowing involves both upper- and lower-body muscles and a variable stroke rate and power output, which can affect the lactate kinetics and the oxygen uptake.
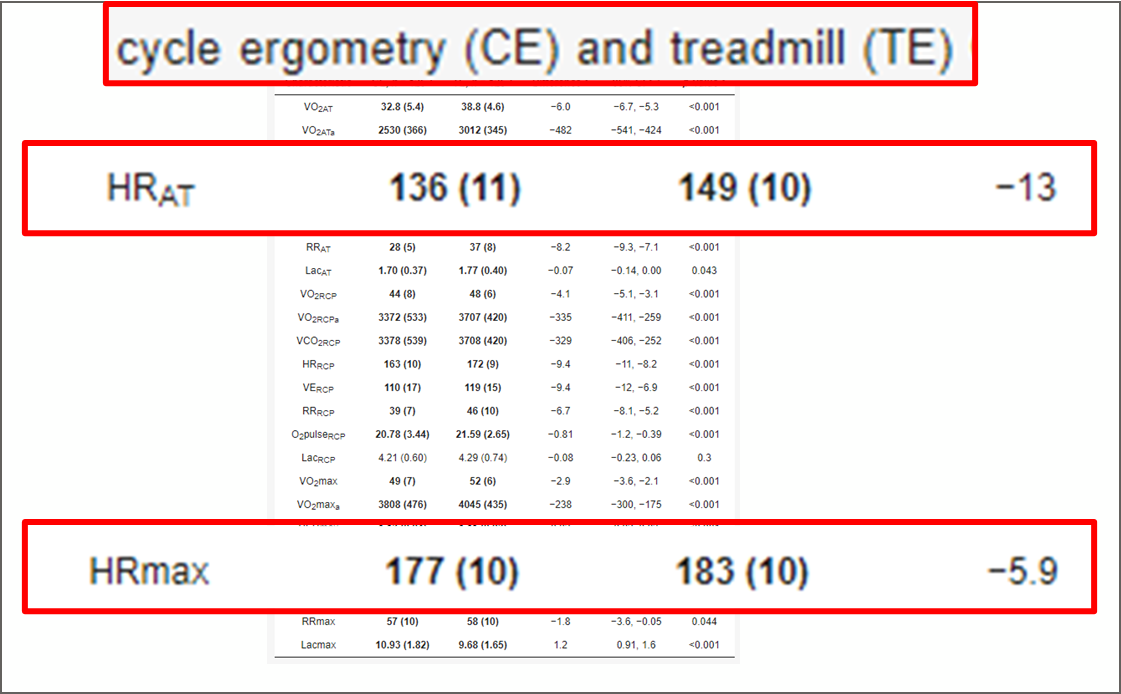
Below is an example of research Differences between Treadmill and Cycle Ergometer Cardiopulmonary Exercise Testing Results in Triathletes and Their Association with Body Composition and Body Mass Index by Szymon et al. [2] that highlights the difference between running and cycling intensity levels. The highlighted values illustrate a 13-heartbeat average difference in research participants in cycling vs. running. Similarly, this illustrates 6 heartbeat average difference between participants. (2)

Therefore, it is important to evaluate and identify the intensity levels for each specific sport, rather than using a general value or transferring the value from one sport to another. Moreover, it is important to consider the sport-specific factors, such as the technique, the equipment, conditions such as terrain, the air or water temperature, and the wind, that can affect the the predefined intensity levels.
Daily Variations
Over time, an athlete’s anaerobic threshold can change due to training adaptations. As the body becomes more conditioned, the threshold may increase, requiring the athlete to adjust their training intensity to continue improving.
The common challenge in intensity measurements are the environmental aspects. If you run in heat, you will expect the heartrate being 10-20 beats higher than usual. This makes is extremely difficult to know if you are still in desired intensity level. Similar challenges are if you measure the intensity with running pace and will be running in technical terrain or winter time in zone. The measurement is not relevant. Altitude can also throw the heartrates of by 10-20 beats.
An athlete's physical condition can vary from day to day due to factors such as sleep, nutrition, stress, and recovery status. The daily personal variation – are you a evening or morning person, will impact the performance within the day. These daily fluctuations can affect the anaerobic threshold, making it difficult to maintain consistent training intensities cross training sessions. These changes can be bigger even within one day.
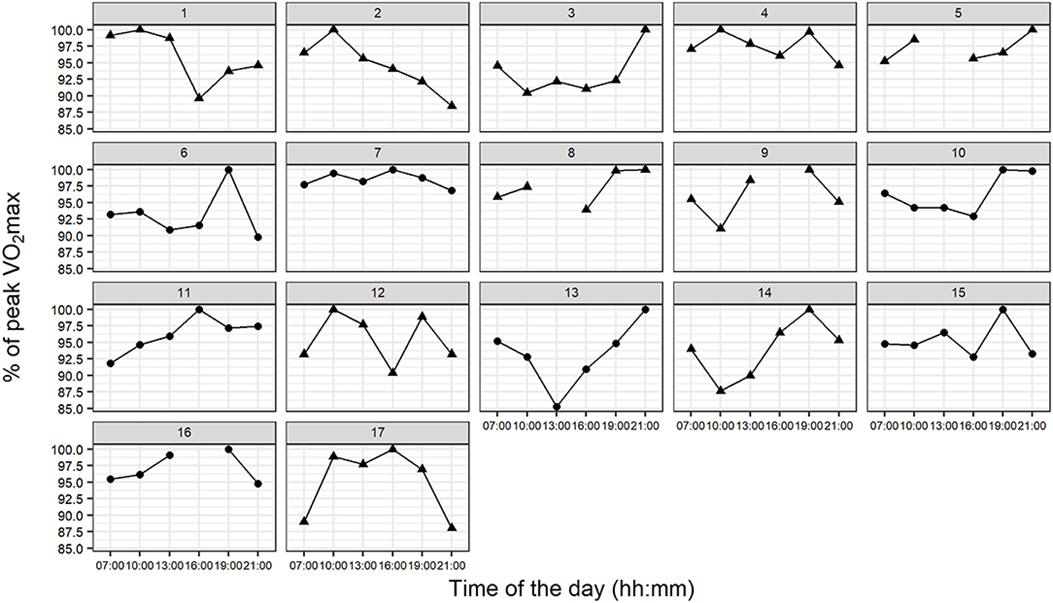
Here is the research In Athletes, the Diurnal Variations in Maximum Oxygen Uptake Are More Than Twice as Large as the Day-to-Day Variations by Knaier R et l [4] illustrating a change of Vo2max during different times of the day of research participants. In this research it was possible to see mean difference in VO2max
- Diurnal variation: 5.0 ± 1.9 ml/kg/min
- Day-to-day variation. 2.0 ± 1.0 ml/kg/min
To quantify the meaning the difference of 5ml/kg/min could mean a ~10-15min difference in marathon run or ~10-15s/km difference in running pace. This in practice could meant that athlete training in Zone 3 is actually training in Zone 5.

Variation of the % of Vo2max during day from – In Athletes, the Diurnal Variations in Maximum Oxygen Uptake Are More Than Twice as Large as the Day-to-Day Variations by Knaier
Intensity During Long Workouts
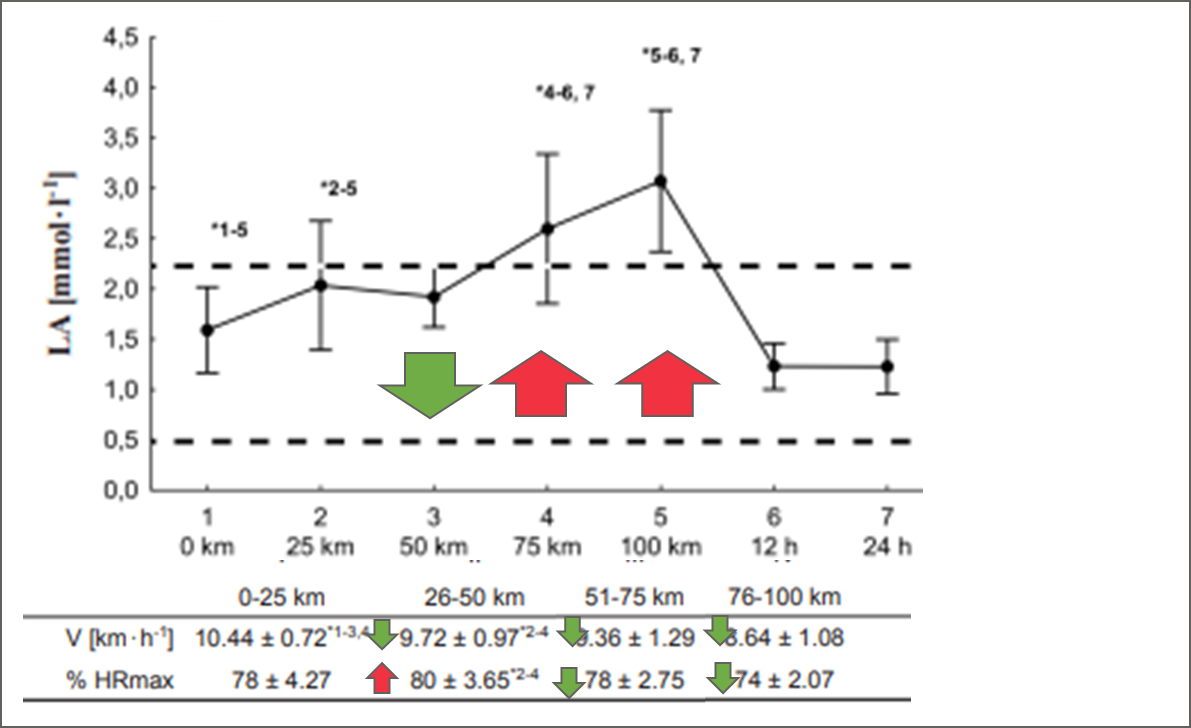
During prolonged workouts, the experience “intensity” of the work will shift due to fatigue and the accumulation of metabolic byproducts like lactate. This can make it challenging for athletes to gauge the correct intensity to train at for optimal performance. Research article Changes in the acid-base balance and lactate concentration in the blood in amateur ultramarathon runners during a 100-km run Jastrzębski Z et al. which was looking at the intensity based on heartrate, pace and lactate during a ultradistance running event. This illustrates the pace and heartrate “intensity metrics” getting step by step lower during the race. Athlete staring the rung with +10km/h or 78% from max hr win start to fade to 8.6km/h and 74% from max hr. Same time the lactate levels are increasing from 1.5 mmol/l gradually to 2 mmol/l and peaking in later stages to 3-4mol/range. This illustrates the challenge for the athlete to use the predefined intensity metrics in pacing in long efforts.

Changes in the acid-base balance and lactate concentration in the blood in amateur ultramarathon runners during a 100-km run Jastrzębski Z et al. The arrows has been added to graphs on this article.
Summary
Intensity refers in endurance sports to metabolic state. Is current effort aerobic or an-aerobic. Accurately determining the anaerobic threshold requires sophisticated equipment and testing protocols, which may not be readily available to all athletes. Field tests and estimations can provide some guidance but may lack the precision of laboratory assessments. The state of the body each day, difference in sports and other factors such heat, altitude or workout duration will impact the intensity level. This creates an obstacle for athletes to measure and monitor the intensity of the workouts in daily training.
ZoneSense with the DDFA index tries to remove this obstacle.
(1) BENEKE, RALPH; von DUVILLARD, SERGE PETELIN. Determination of maximal lactate steady state response in selected sports events. Medicine & Science in Sports & Exercise 28(2): p 241-246, February 1996. https://journals.lww.com/acsm-msse/fulltext/1996/02000/determination_of_maximal_lactate_steady_state.13.aspx
(2) Differences between Treadmill and Cycle Ergometer Cardiopulmonary Exercise Testing Results in Triathletes and Their Association with Body Composition and Body Mass Index by Szymon Price 1,Szczepan Wiecha 2,*ORCID,Igor Cieśliński 2,Daniel Śliż 1,3,*ORCID,Przemysław Seweryn Kasiak 4ORCID,Jacek Lach 1,Grzegorz Gruba 4ORCID,Tomasz Kowalski 5ORCID andArtur Mamcarz 1ORCID Int. J. Environ. Res. Public Health 2022, 19(6), 3557; https://doi.org/10.3390/ijerph19063557
(3) Poole, D.C., Rossiter, H.B., Brooks, G.A. and Gladden, L.B. (2021), The anaerobic threshold: 50+ years of controversy. J Physiol, 599: 737-767. https://doi.org/10.1113/JP279963
(4) Knaier R, Qian J, Roth R, Infanger D, Notter T, Wang W, Cajochen C, Scheer FAJL. Diurnal Variation in Maximum Endurance and Maximum Strength Performance: A Systematic Review and Meta-analysis. Med Sci Sports Exerc. 2022 Jan 1;54(1):169-180. doi: 10.1249/MSS.0000000000002773. PMID: 34431827; PMCID: PMC10308487.
(5) Jastrzębski Z, Żychowska M, Konieczna A, Ratkowski W, Radzimiński Ł. Changes in the acid-base balance and lactate concentration in the blood in amateur ultramarathon runners during a 100-km run. Biol Sport. 2015 Sep;32(3):261-5. doi: 10.5604/20831862.1163372. Epub 2015 Jul 31. PMID: 26424931; PMCID: PMC4577565.