ZoneSense offers insights into whether your body's physiology is working aerobically with lower stress levels or if it has transitioned into higher stress, anaerobic efforts.
Different sports impose varying demands on your cardiovascular system. Measuring intensity with heart rate can be difficult as the heart rate changes across different activities such as cycling and cross-country skiing, where same heart rate can be aerobic in one sport and an-aerobic in another. Additionally, daily performance fluctuations up to 5-10% can make it challenging to use predefined intensity levels.
ZoneSense addresses these challenges by measuring the heart's response to workout intensity in real-time. This innovative technology empowers athletes to monitor their exertion levels daily across various sports disciplines. The following examples show how the ZoneSense measures your heart in different activities.
Aerobic sessions
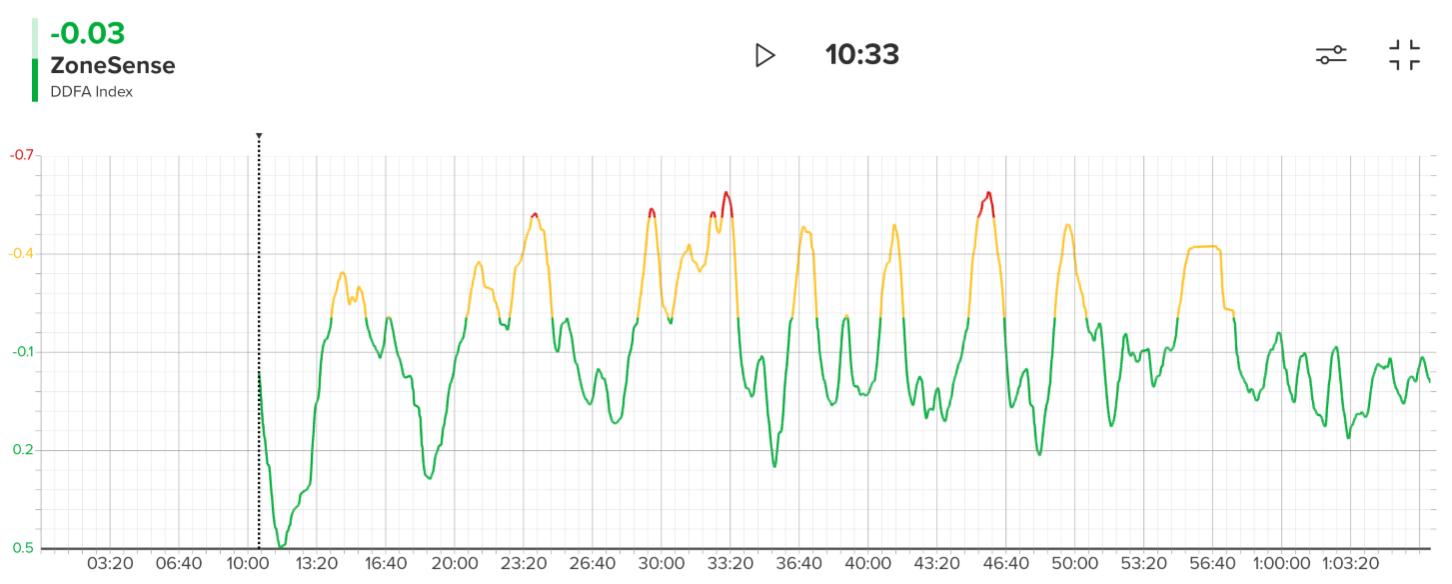
Aerobic long run
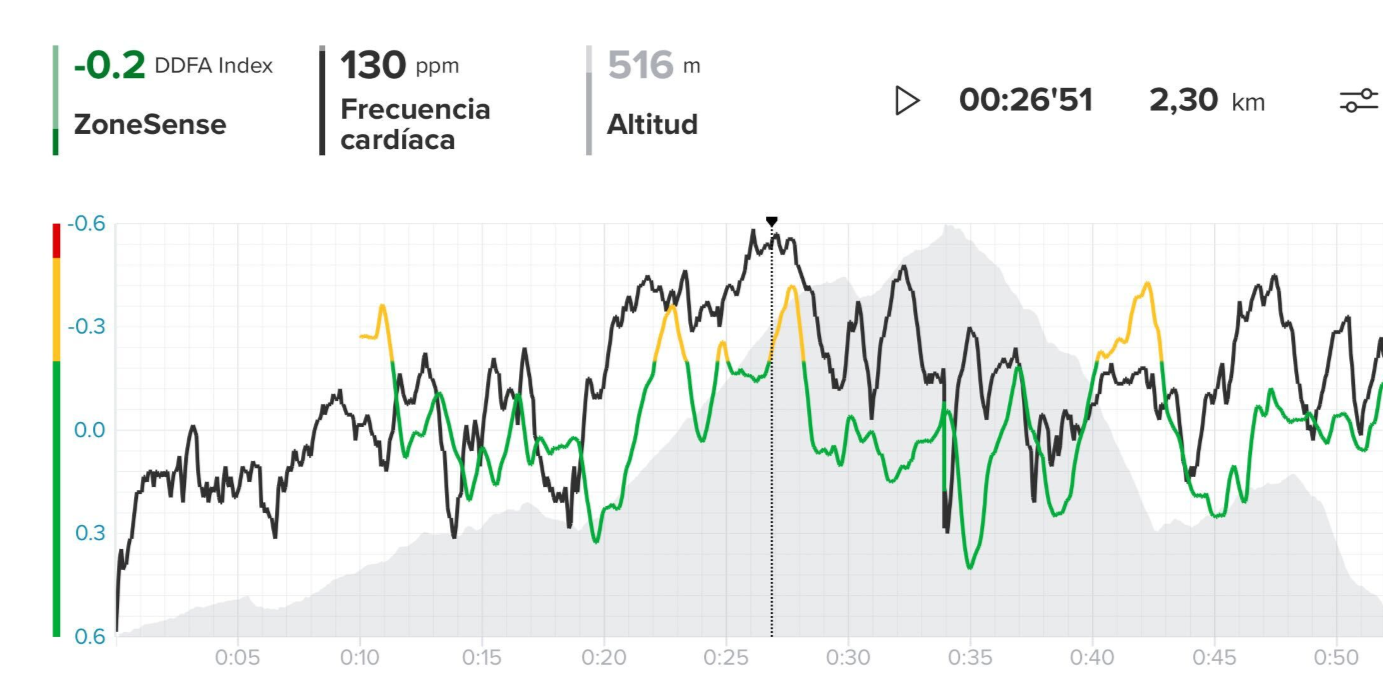
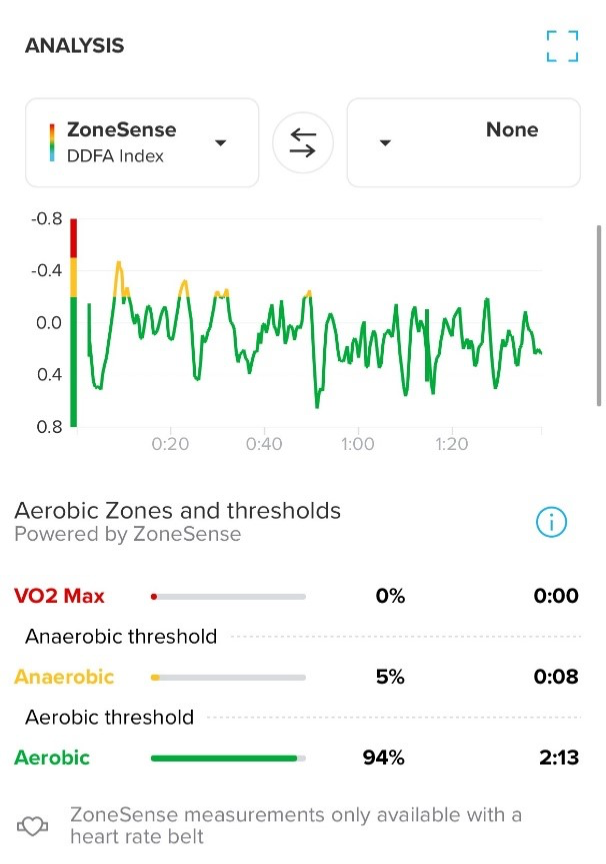
To keep the long runs purely aerobic, athlete should keep the ZoneSense state green most of the time. Its normal to see constant fluctuation of the DDFA index value in easy efforts such as in this example mainly around +0 - +0.4. On outdoor runs where athlete might need go over some hills, the Zonesense can illustrate this by turning to an-aerobic time to time. This type of few spikes that goes bit over aerobic threshold, is normal aerobic workouts.
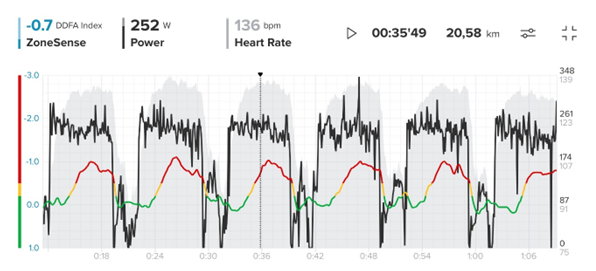
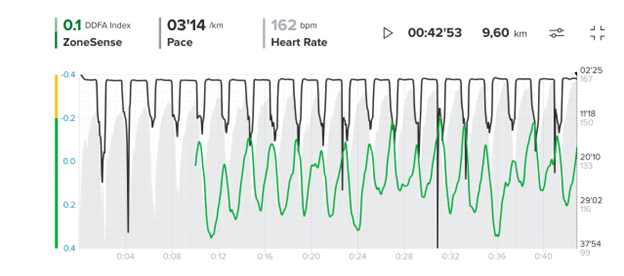
Long ride with 3x45min an-aerobic effort
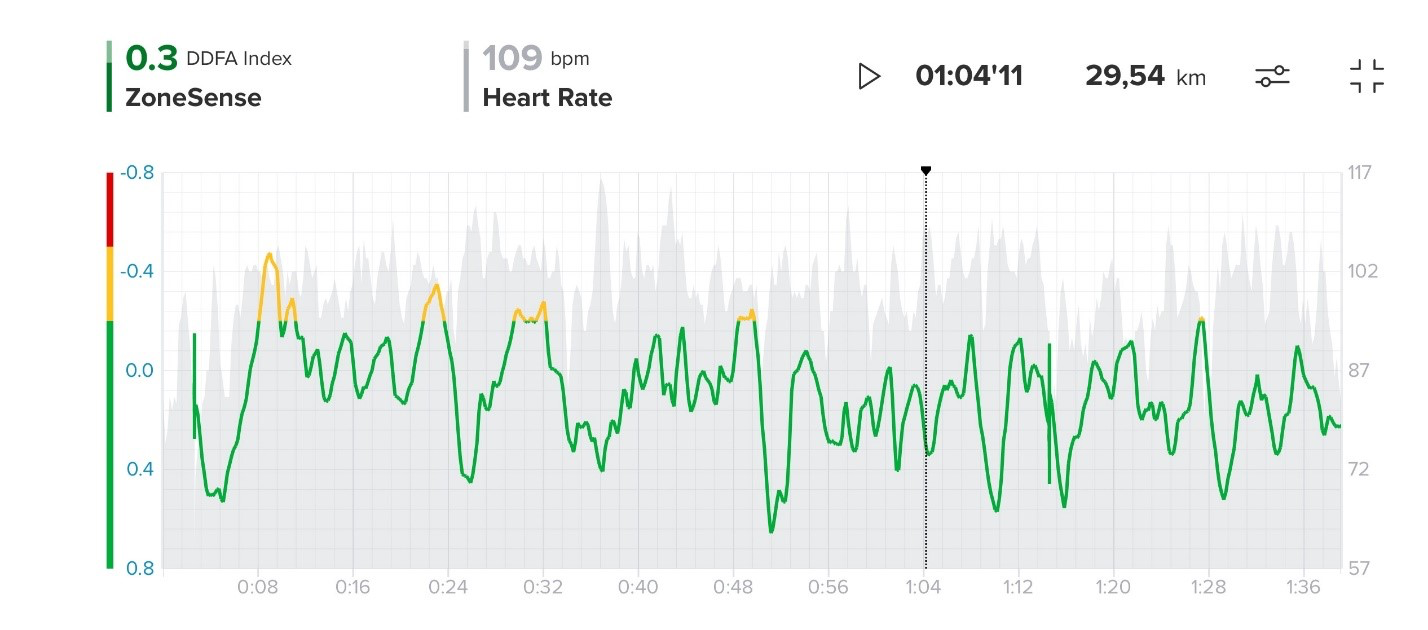
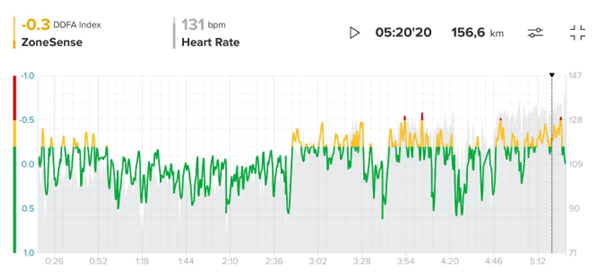
The example illustrates a long bike ride of 5.5 hours, where the last part of the ride includes three 45minute sections with “Ironman race pace effort”. The three 45min work sections illustrate the effort at and above aerobic threshold as DDFA index turn mostly to yellow. As the temperature is close to 30 degrees, one can observe a raised heartrate after 3.5 hours, where the workout intensity is kept the same, but heart rate has now elevated by 15-20 beats per minute. ZoneSense however shows the steady intensity level.
Interval sessions
Long intervals - Cycling
The harder interval sessions where athlete is working at an-aerobic threshold or even above can be hard to quantify on everyday sessions, do I go too hard or is it too easy. The ZoneSense helps to illustrate if you were reaching the threshold or did you go even beyond. The example here illustrates 6 x 7 min intervals above an-aerobic threshold. The ZoneSense gradually increases during the first 2-3 minutes in interval to get above threshold level.
Interval workouts are a common way to do the harder training efforts. ZoneSense DDFA index requires a longer period of consistent intensity due to time it takes the body to reach the homeostasis. The ZoneSense requires the effort to be consistent at least 2-3 minutes
to accurately represent the intensity level, with shortchanges this is not achieved. In the above example if the interval would have been stopped after 2 minutes, even with high effort the ZoneSense would have not reached the an-aerobic state. This can also be seen from the heart rate in the background, during the first 2 minutes the heart rate is rising despite constant effort. This is caused by the heart’s slow adaptation to the changed intensity level.
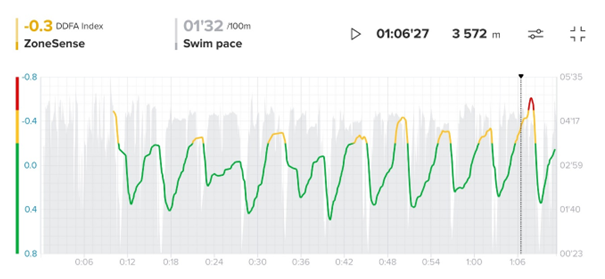
Long intervals - Open Water Swimming
ZoneSense is not limited only to most common endurance sports such as running and cycling. Here is an example of an open water swim session where an athlete has done a 12 x 300m repetitions in lake with a short 30-45s rest between. The goal of the session has been to swim in good sustainable tempo pace. The ZoneSense illustrates this by reaching the an-aerobic level at end of each repetition. The pace is kept the same except with the last one being harder. The cumulative load of the work is illustrated by the last half of the repetitions always reaching an-aerobic state where the first ones don’t all reach this.
Long intervals - Rowing
Following is a rowing workout 4x6min hard efforts and 8x 40s with 20s recovery. ZoneSense shows effort reaching to over an-aerobic threshold. The shorts repetitions also reach red, as recovery is short.
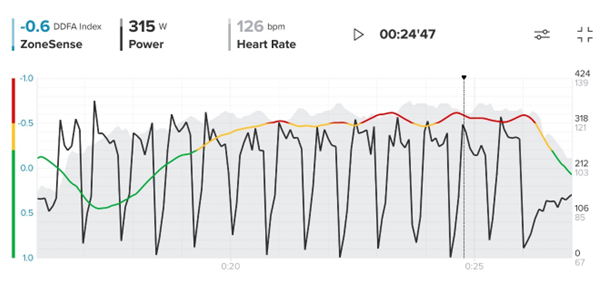
Short intervals with short recovery - Cycling
With high volume of short intervals done with short recovery, the ZoneSense is able to illustrate the cumulative intensity. The example here illustrates the large volume of intervals with short recovery, 13x30s with 15second recovery. This effort can be shown as a black line illustrating cycling power. The ZoneSense DDFA index grows during the first five repetitions into an-aerobic range and then with next few following reps will reach the vo2max range represented in red color. This illustrates nicely the load for higher volume reps where the effort in power can be argued to be on correct level. Here the 15 seconds recovery is so short that the body’s homeostasis doesn’t recover into low intensity between the repetitions and rather describes the cumulative intensity of the constant intervals.
Short intervals with long recovery - Running
The ZoneSense is not able to monitor short bursts with longer recovery sessions in a meaningful manner. ZoneSense requires to reach a homeostasis with the intensity. The running interval example with 20x400m with 40 s recovery illustrates that the measurement does not indicate the harder running pace as interval duration is short with relatively long recovery. If the intervals would have been longer each interval would have reached an-aerobic intensity or if recovery would have been shorter the cumulative intensity impact would have been shown as in the previous example.
Higher Intensity Near Anaerobic Threshold
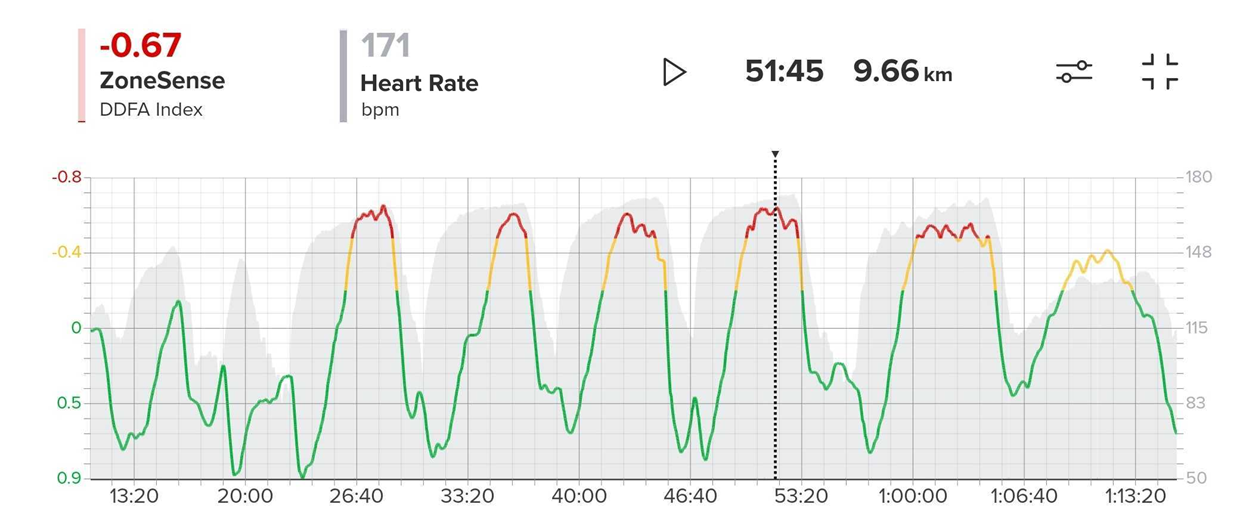
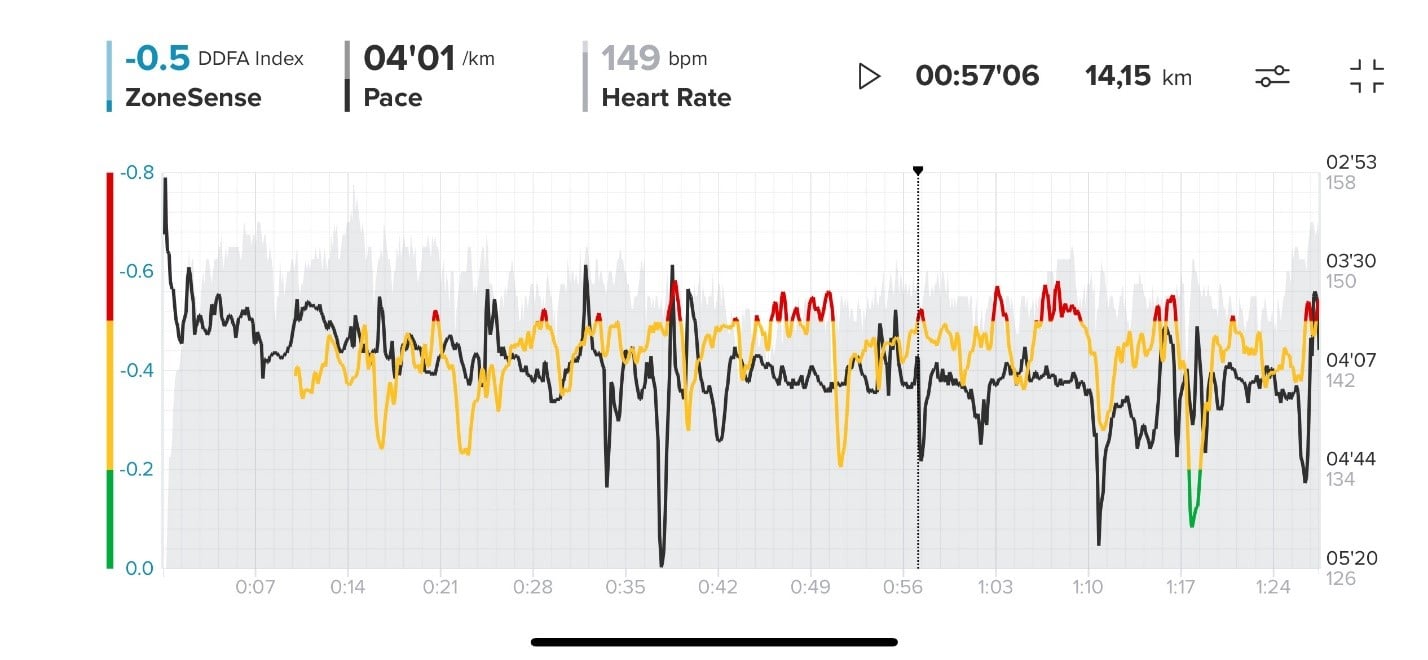
Half marathon
The following examples illustrate the ZoneSense in session where intensity is an-aerobic and reaches regularly an-aerobic threshold level. This example is from a half marathon race where recreational runner is pushing their own limits close to 1.5hours. The racecourse has some turns and hills, which impact on the intensity effort that athlete is working. The ZoneSense shows the intensity at an-aerobic effort in yellow with several sections shown at red in vo2 range. When comparing the black line illustrating the pace, one can observe a slight gradual decline of the pace. Similarly, one can see slight decline in heartrate. However the ZoneSense illustrate the yellow & red sections as athlete has tried to keep the intensity as high as possible.
Ice hockey with various effort spikes.
Its common method for endurance sports athletes to do a performance test in laboratory to establish the aerobic and an-aerobic levels as heart rate, pace or power. But for many sports this is not possible as the laboratory protocols do not represent sport in real life. Here is an example of an ice hockey game where players have been using ZoneSense to measure their effort during the game. Each work effort is shown as an-aerobic work where spikes in VO2max area.
For team sports such as ice hockey, football, basketball its very difficult to understand the real intensity levels as laboratory test done in treadmill or exercise bike doesn’t truly correlate to the effort in the field. ZoneSense could be a solution for some of these sports or training sessions for these athletes.
The challenge with ZoneSense is the requirement for constant work. Effort that leads to homeostasis a.k.a. balance needs to be long enough to DDFA index truly represent the intensity of the work. With many team sports and racquet sports, this can be a limitation with very short work durations and long rest periods. However, even if the games themselves couldn’t be measured with ZoneSense the training sessions with enough cumulative work could potentially be applicable for ZoneSense. This would be the long waited intensity measurement in team sports.
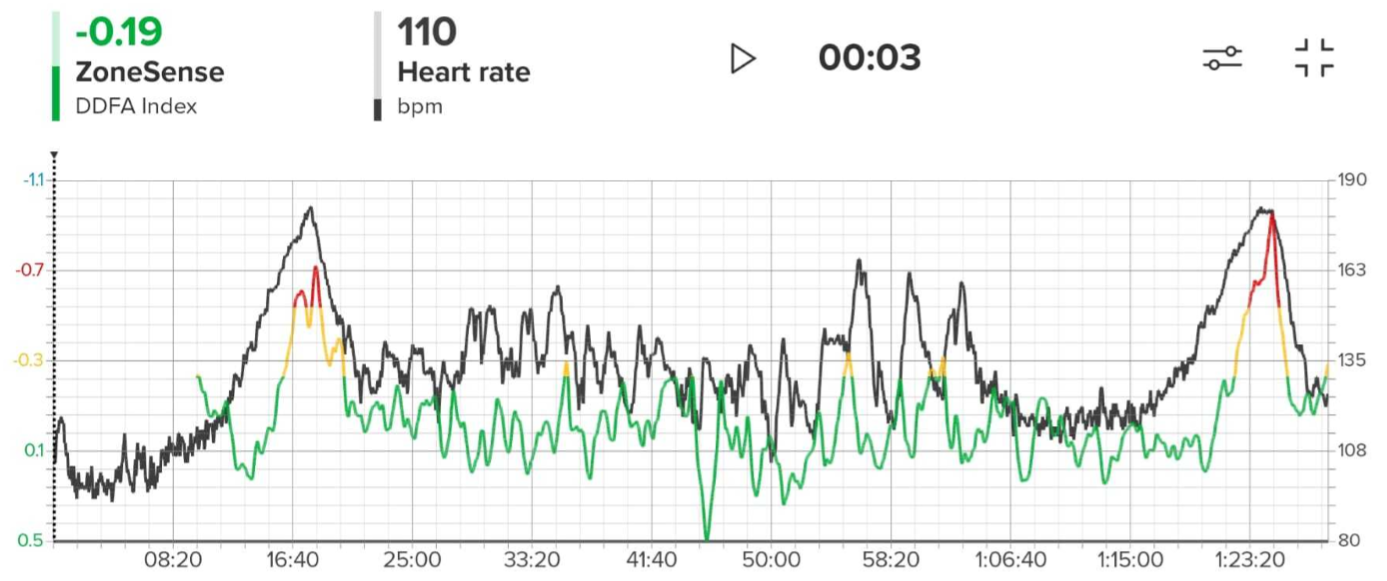
Muscle fatigue impact
ZoneSense is measuring stress with heart rate variability. This stress effect correlates to metabolic state of the body, where less stress is aerobic, and more is an-aerobic. However, the metabolic state is not the only effect but can be induced with other stress factors. Here is a test example where an athlete has done two ramp up protocols with ergometer in one workout. The first part can be seen from 8min-16min and the second at 1h 15min – 1h 23min. The middle part of the session was strength training heavy leg exercises. The impact of fatigue in leg muscles can be witnessed on the ramp up protocol where ZoneSense reaches a higher intensity range compared to the first version. The impact is not massive, but still illustrates the other stressful factors.
By measuring the actual response of the heart to workout intensity, ZoneSense offers athletes a reliable and daily tool to optimize their training across different sports. This
technology is set to revolutionize how athletes understand and manage their physical stress levels, enhancing performance and recovery.
A similar impact of muscle load and potential different intensity levels can be found in the hiking session. The steep uphill and downhill make the workout become an-aerobic. Where the heartrate itself especially in downhill wouldn’t indicate this. The muscle fatigue and stress associated raises the ZoneSense intensity.